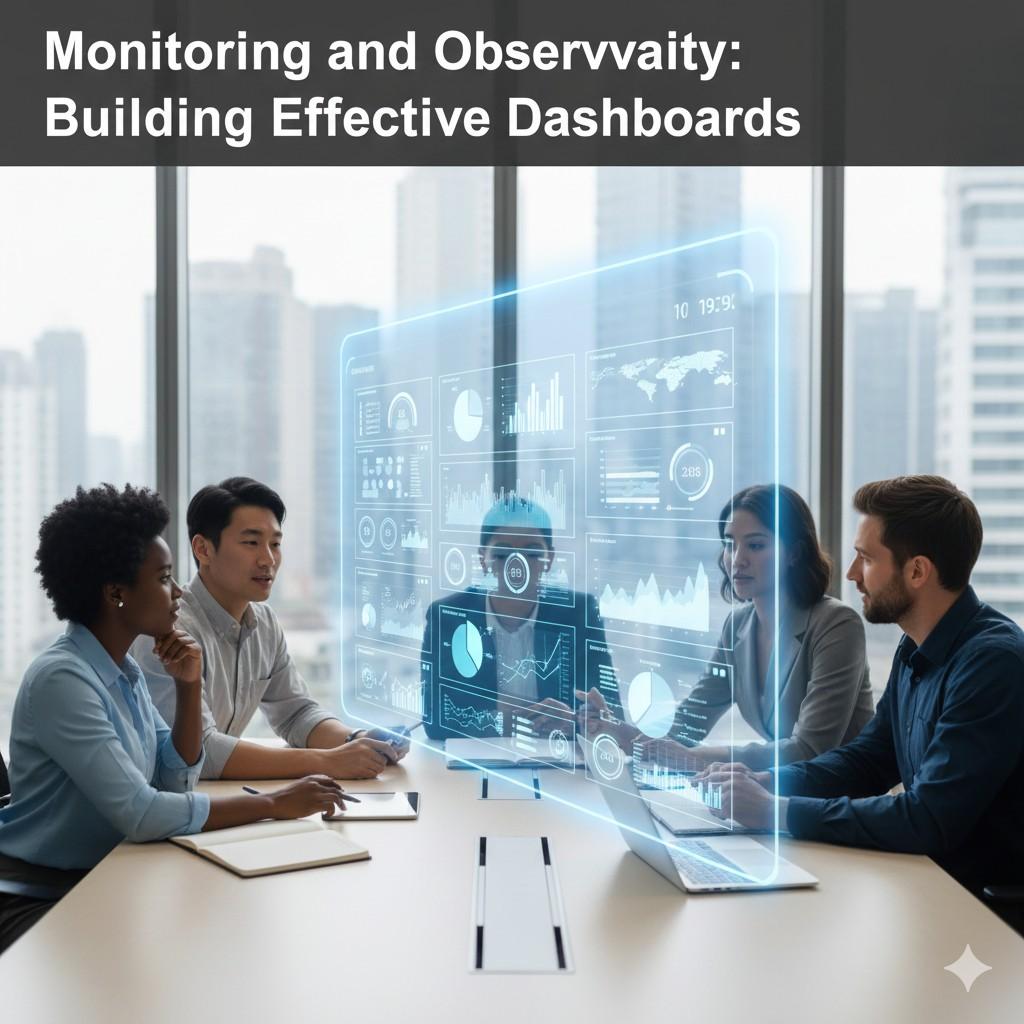
Beyond Basic Monitoring
Monitoring tells you when something is wrong. Observability helps you understand why. Effective dashboards bridge the gap, providing actionable insights that enable rapid incident response and informed decision-making.
The Three Pillars of Observability
Metrics: What is Happening
Time-series data that quantifies system behavior:
- Counter - Monotonically increasing (requests served)
- Gauge - Current value (CPU usage, memory)
- Histogram - Distribution (request duration)
- Summary - Percentiles over time
Logs: Detailed Event Records
Structured logs provide context for metrics:
Traces: Request Journeys
Distributed tracing shows how requests flow through your system, identifying bottlenecks and failures across services.
Great observability answers three questions: Is there a problem? Where is it? What caused it?
Dashboard Design Principles
Start with User Impact
Your primary dashboard should answer: "Are users happy?"
- Success rate of critical user journeys
- Response time percentiles (P50, P95, P99)
- Error rates by type
- Apdex score or similar satisfaction metric
USE Method for Resources
For every resource, monitor:
- Utilization - How busy is it?
- Saturation - How much queued work?
- Errors - What's failing?
RED Method for Services
For every service, track:
- Rate - Requests per second
- Errors - Failed requests
- Duration - Response time
Effective Alerts
Alert on Symptoms, Not Causes
Alert when users are impacted, not when a single server is down:
- Good - "API error rate exceeds 5%"
- Bad - "Server CPU usage above 80%"
Reduce Alert Fatigue
Too many alerts lead to ignored alerts:
- Set appropriate thresholds based on data
- Use alert suppression during known maintenance
- Implement alert escalation policies
- Regularly review and tune alerts
- Delete alerts that don't lead to action
Dashboard Organization
Layered Approach
Create multiple dashboard levels:
- Executive - Business metrics, high-level health
- Service Owner - Service-specific metrics
- On-Call - Troubleshooting focused
- Detailed - Deep dive into specific components
Tools and Technologies
Popular Monitoring Stacks
- Prometheus + Grafana - Open source, powerful
- Datadog - Commercial, comprehensive
- New Relic - APM focused
- ELK Stack - Log aggregation and analysis
Conclusion
Effective observability requires thoughtful instrumentation, well-designed dashboards, and actionable alerts. Focus on user impact, reduce noise, and continuously refine based on incident learnings.
Related Topics
Cooper Wilson
Observability Engineer
Expert in cloud infrastructure and container orchestration with over 10 years of experience helping enterprises modernize their technology stack and implement scalable solutions.